Data Murals

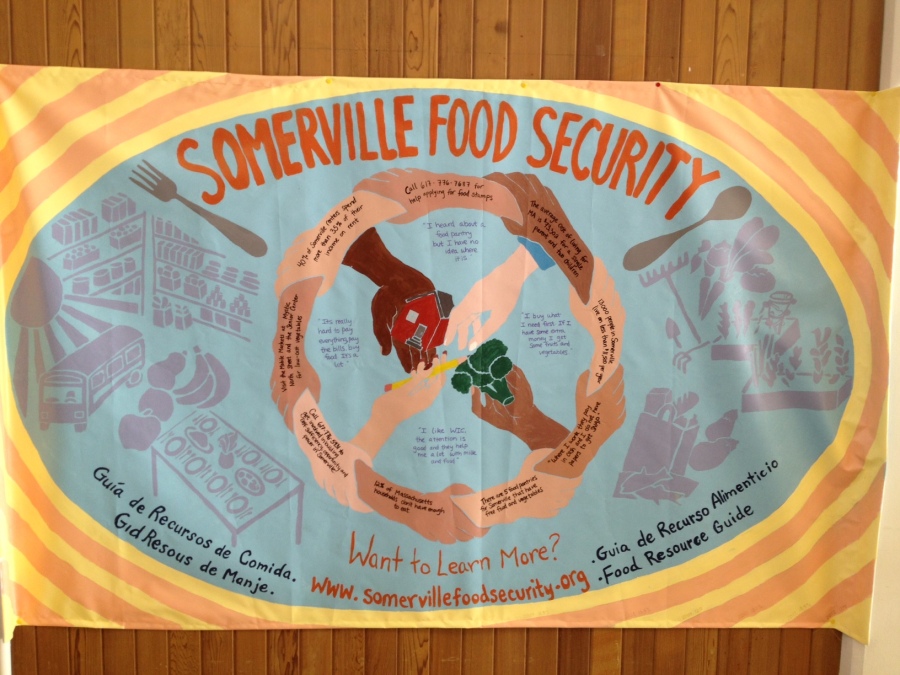
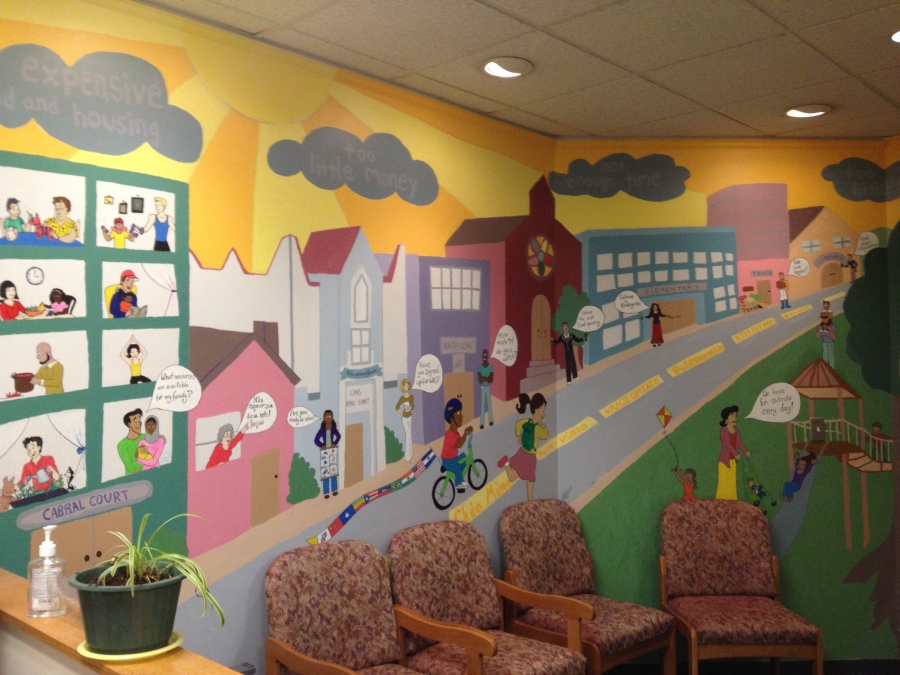
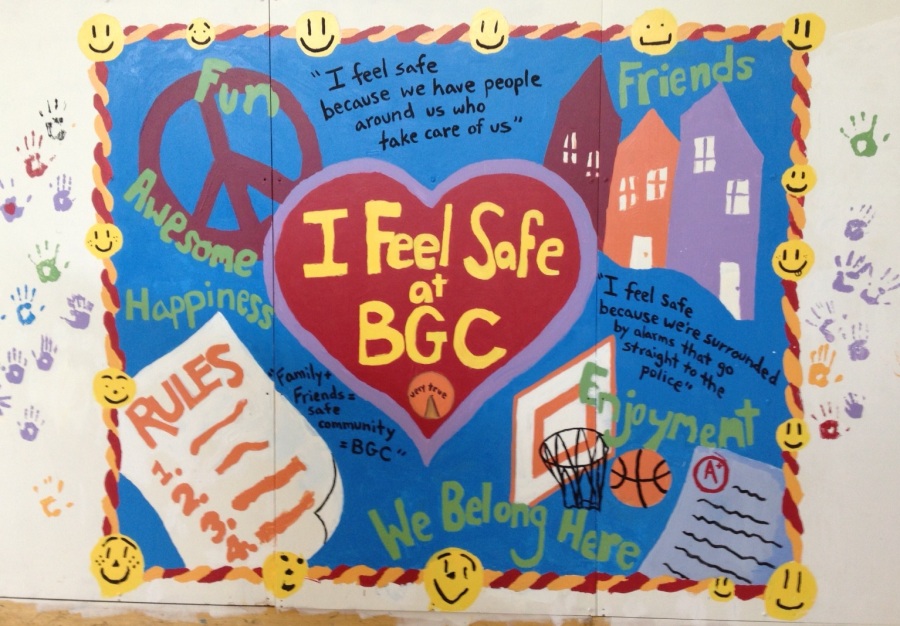
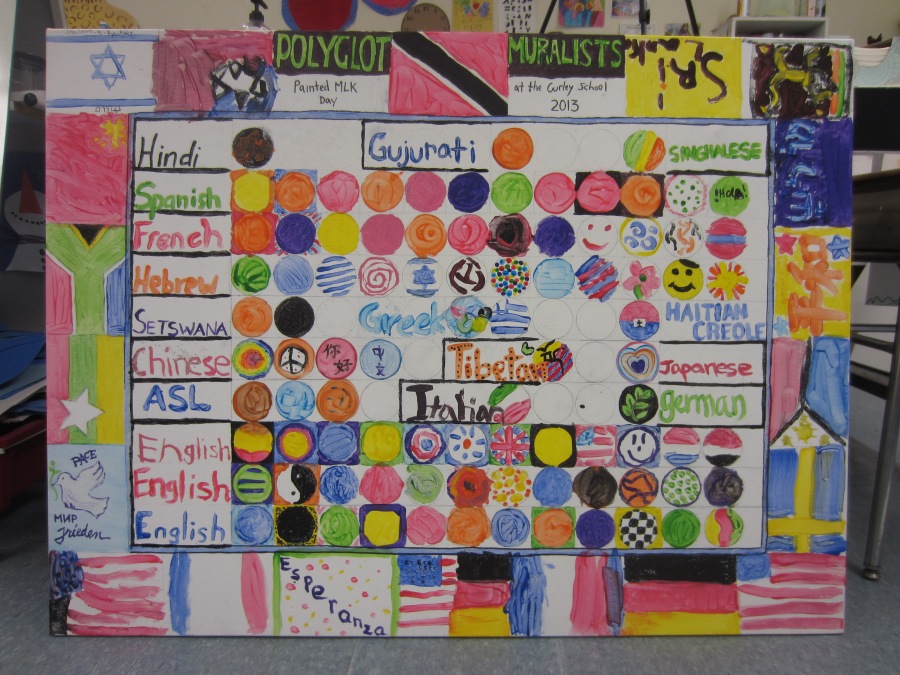
After finding a strong lack of artistic examples of data presentation, we decided to make some Data Murals of our own!  We help a group find a story in their data, collaboratively crete a visual design that tells the story, and then paint it as a community mural.  Read some more about creating your own data mural.

📰 Read our new academic case study about the mural we did in Brazil!

We’ve done a number of data murals, in the US and beyond.  Here’s a small gallery of that work:
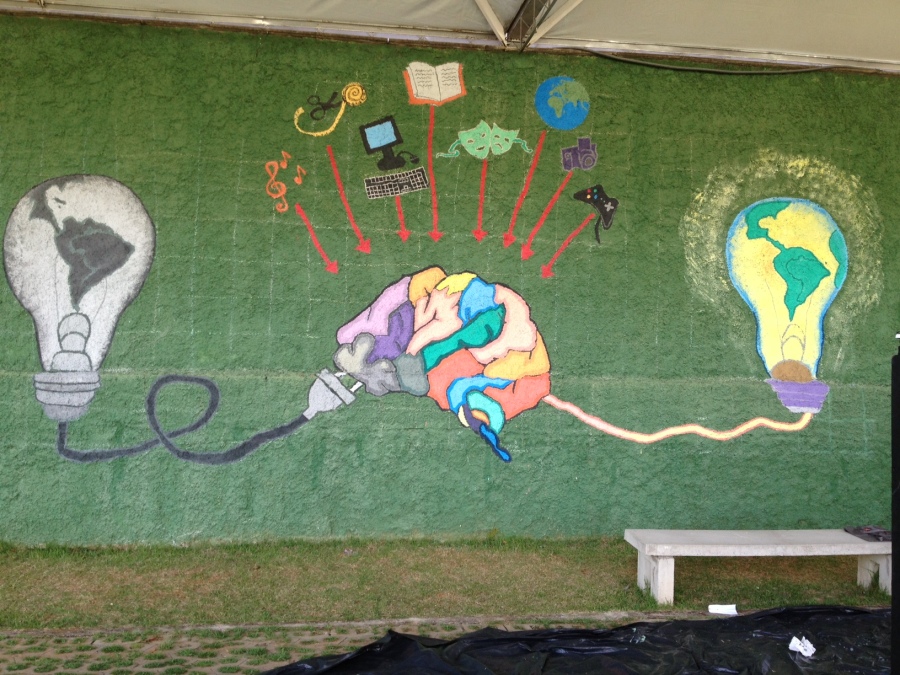
Created by students at PlugMinas in Belo Horizonte, Brazil (March 2014)
Created by the Somerville Food Security Coalition (November 2013)
Created by the Somerville Food Security Coalition (November 2013). Look at the handout for more details about what each visual element represents.
Created by the Collaborate for Healthy Weight Coalition (August 2013)
Created by Growndwork Somerville (August 2013)
Created by the Boys and Girls Club of Cambridge, MA (May 2013)
Created by residents of Jamaica Plains, Boston (January 2013)

Leave a comment